Uptime Monitor
Available in Starter plan and above
What is uptime monitoring?
Uptime monitoring checks websites or web services at regular intervals to ensure they’re available and responding correctly. Use it to:
- Detect outages and performance issues on your websites
- Monitor pages that aren’t yet accessible but may become available later
- Track API and service availability
Supported HTTP methods
- GET — Retrieves data from a resource (most common for uptime checks)
- POST — Creates a new resource
- PUT — Replaces an existing resource
- PATCH — Partially modifies a resource
- DELETE — Removes a resource
Note: POST, PUT, PATCH, and DELETE are typically used for APIs and are less common for basic uptime monitoring.
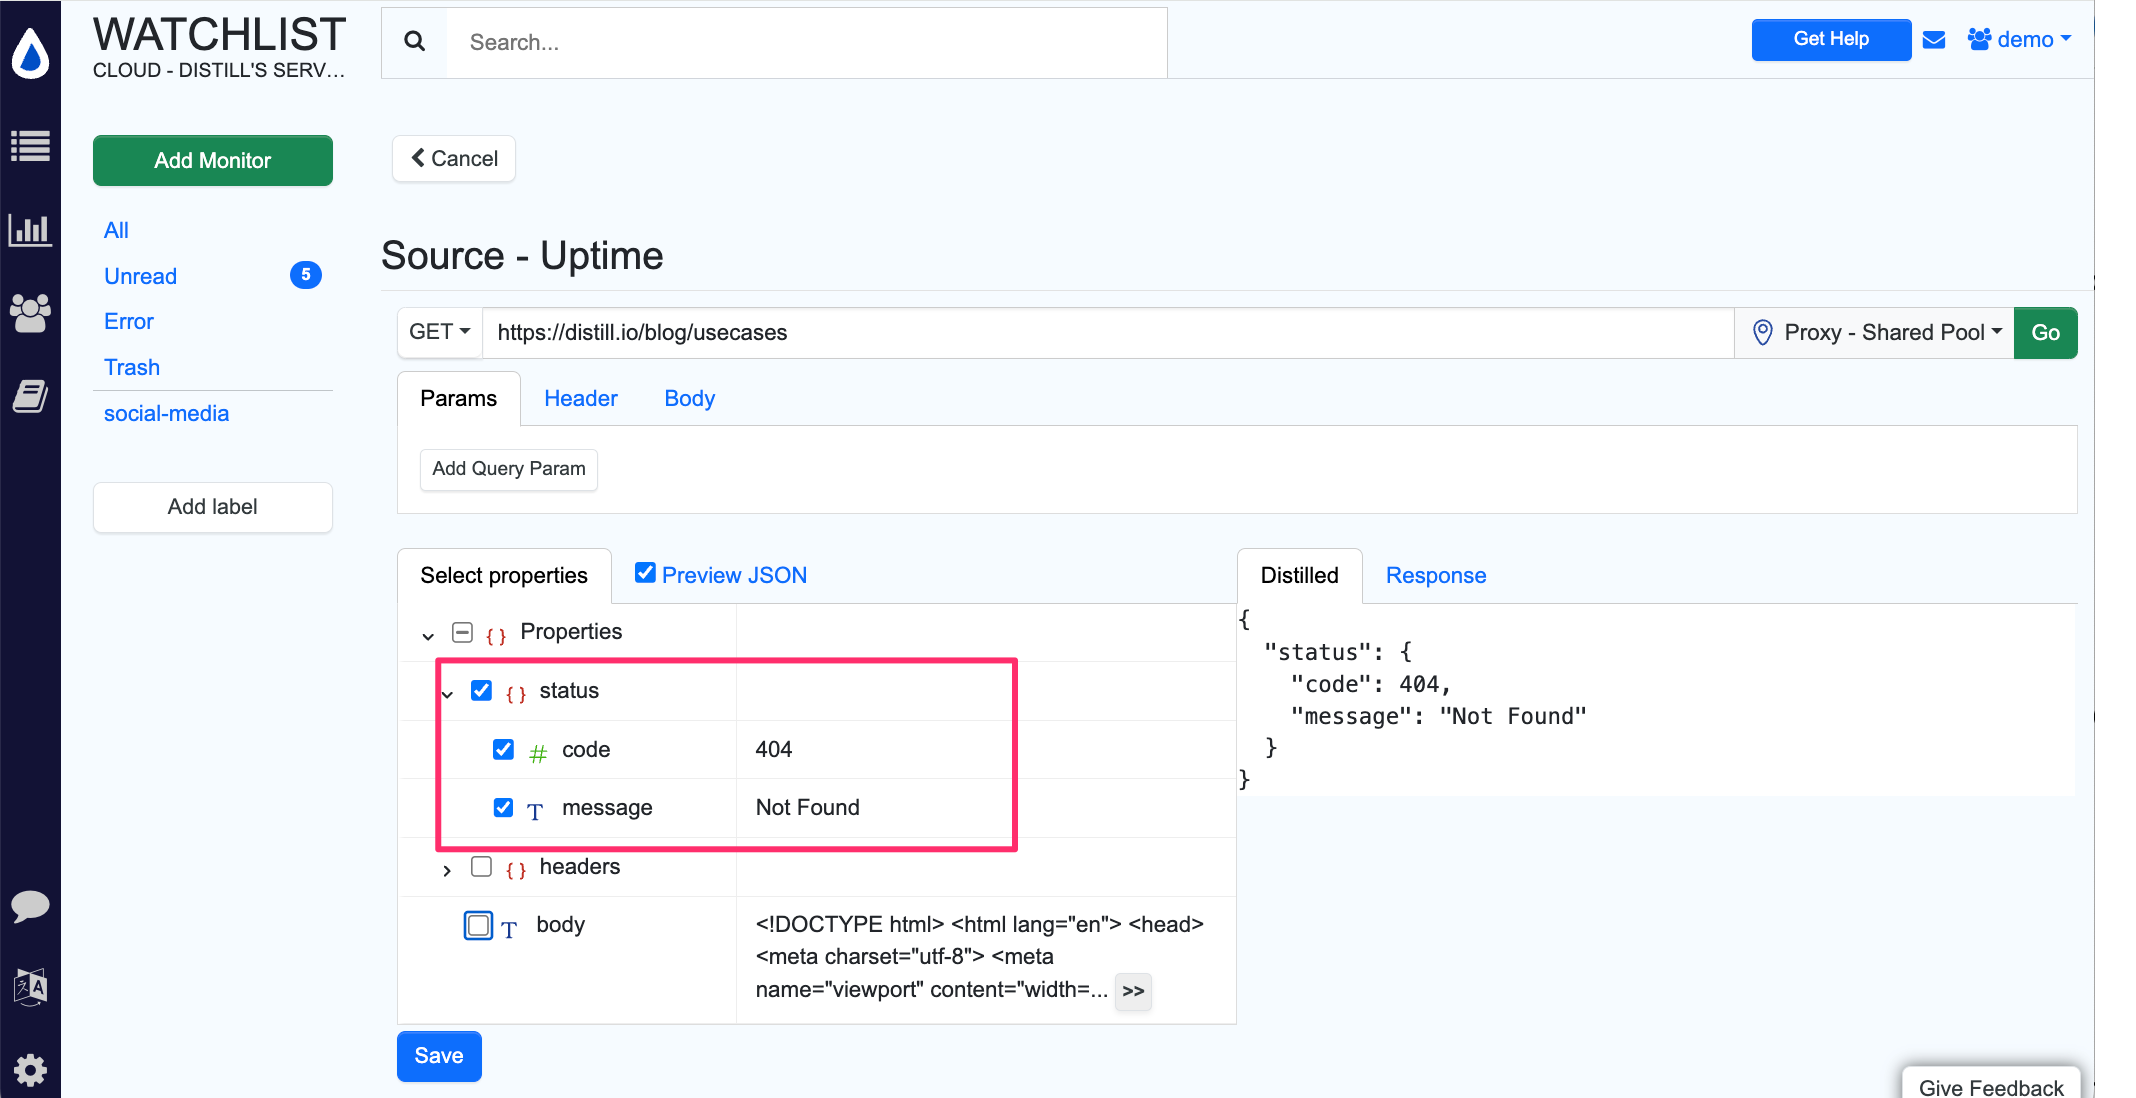
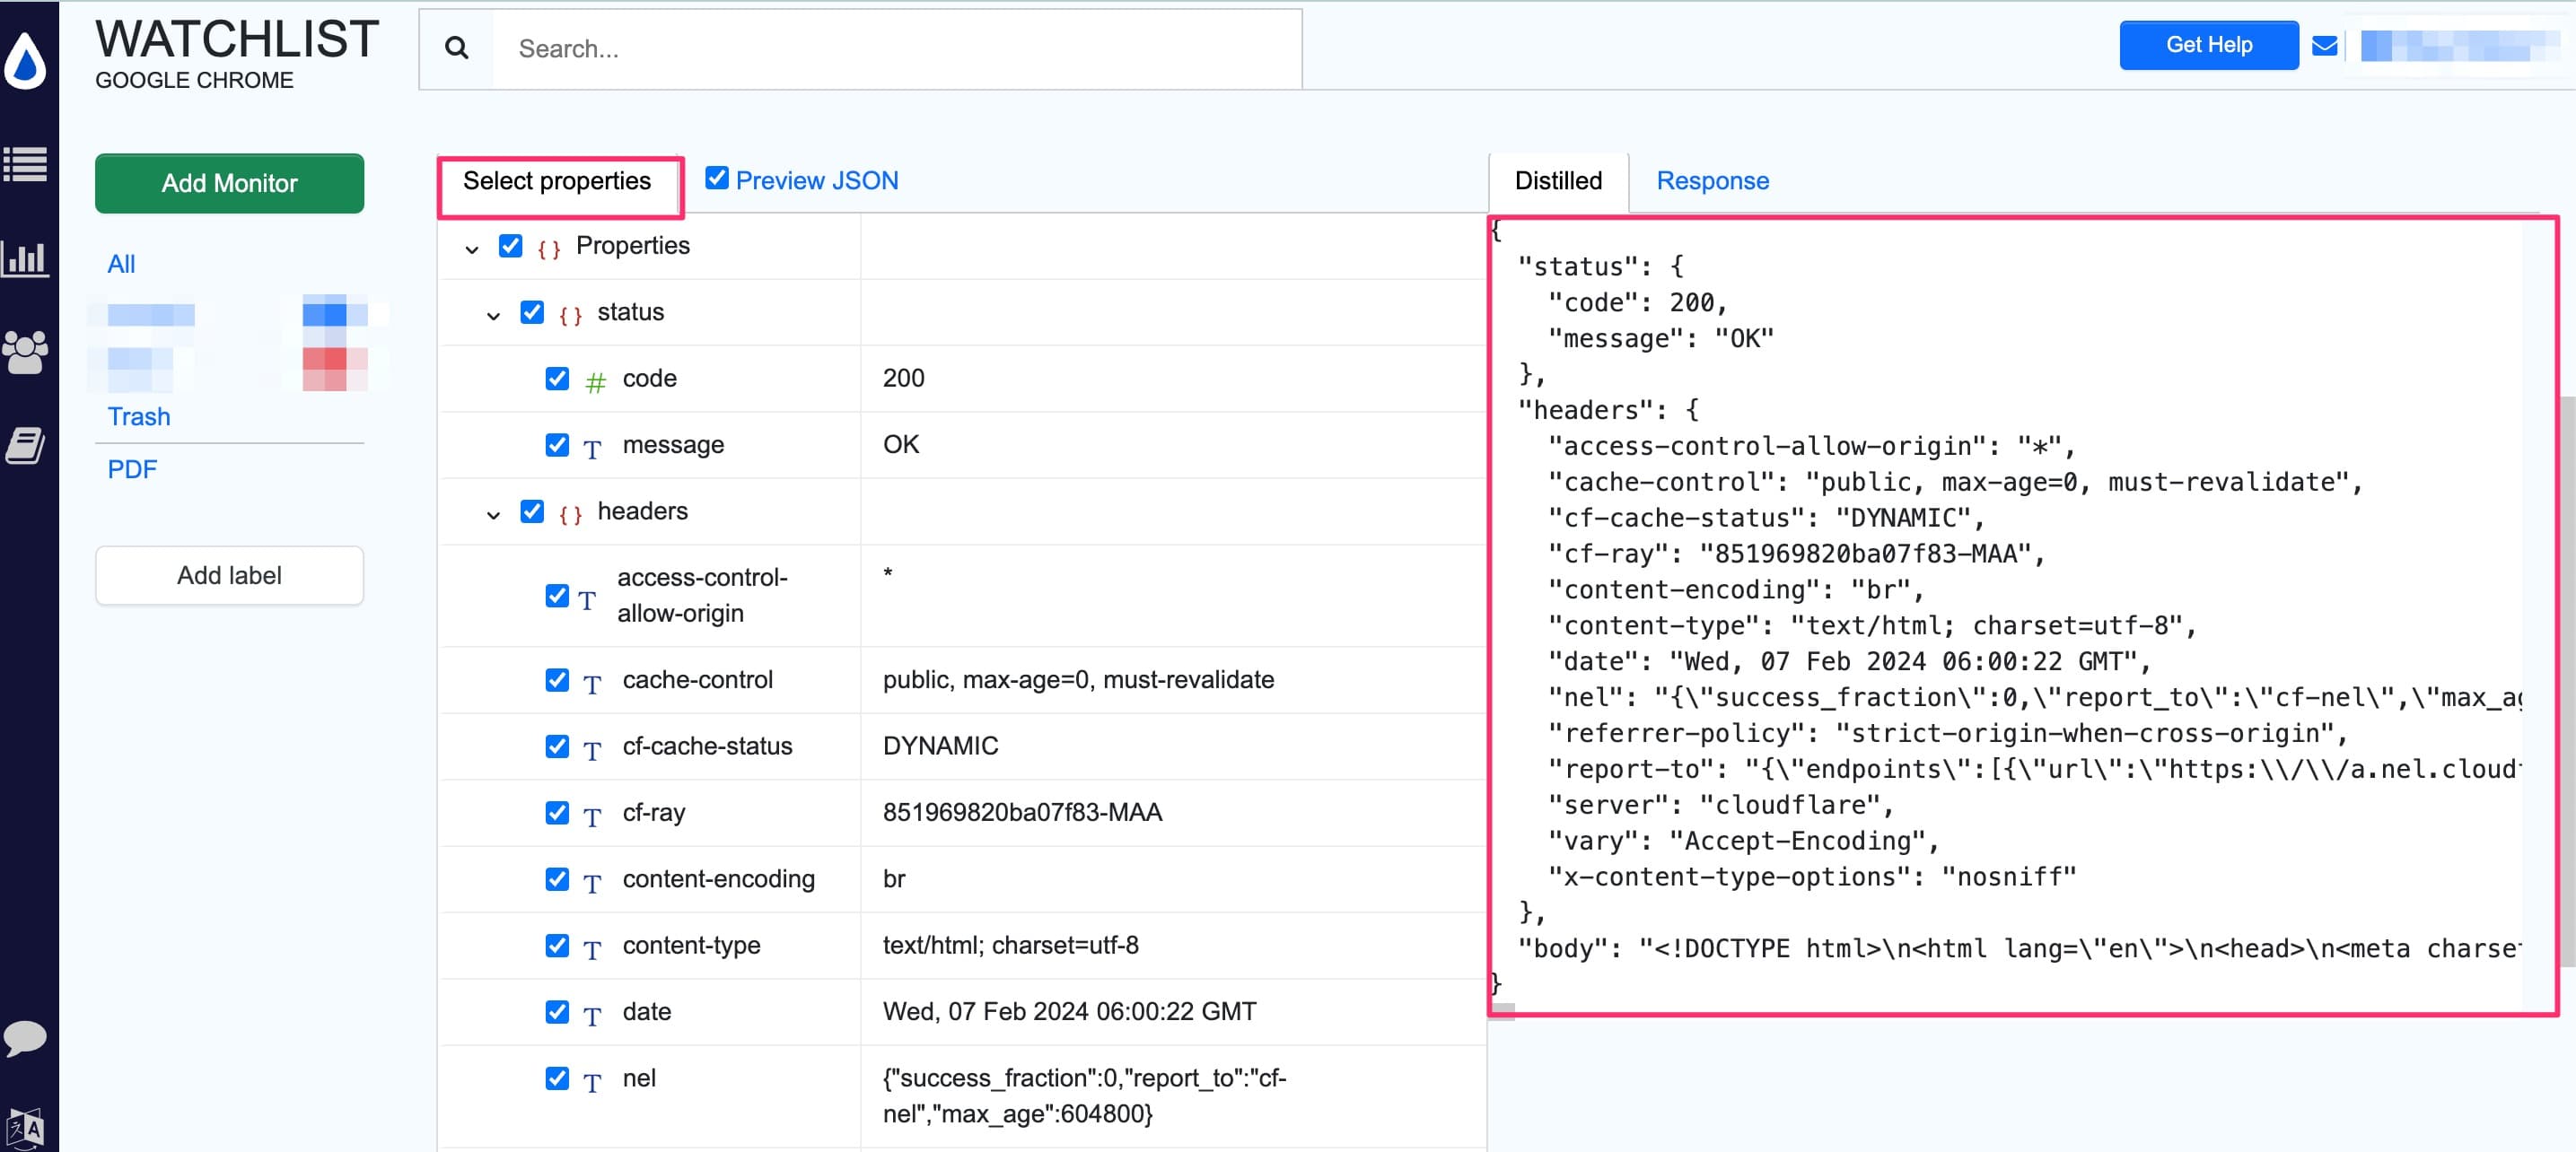
Properties to monitor
When monitoring uptime, you can track different parts of the server’s HTTP response:
Status code
The HTTP status code indicates request success or failure. This is the most common property for uptime checks.
200— OK (successful request)404— Not Found500— Internal Server Error
Learn more about HTTP status codes
Headers
Response headers provide additional metadata about the server’s response, such as Content-Type, Content-Length, and custom health-check headers.
Body
The response body contains the actual content (HTML, JSON, XML, etc.). The body is less commonly used for uptime checks since you’re typically verifying accessibility, not content.
For content monitoring, use a web page monitor instead.
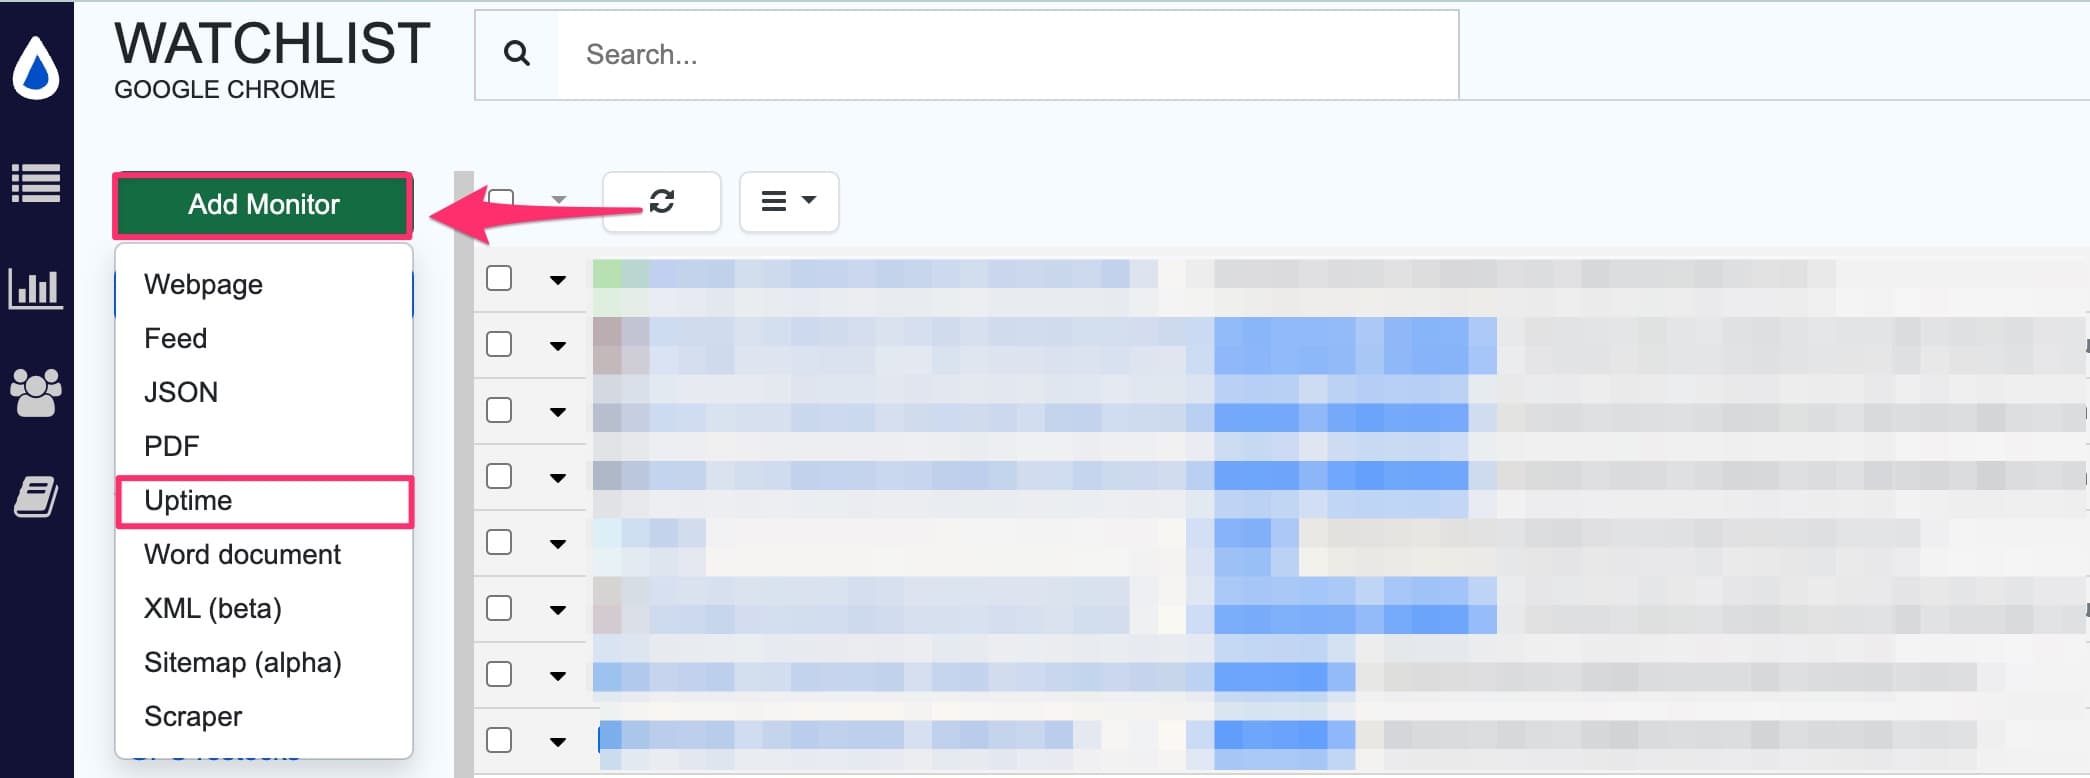
Set up an uptime monitor
-
Open the Watchlist at https://monitor.distill.io or in your browser extension
-
Click Add Monitor → Uptime
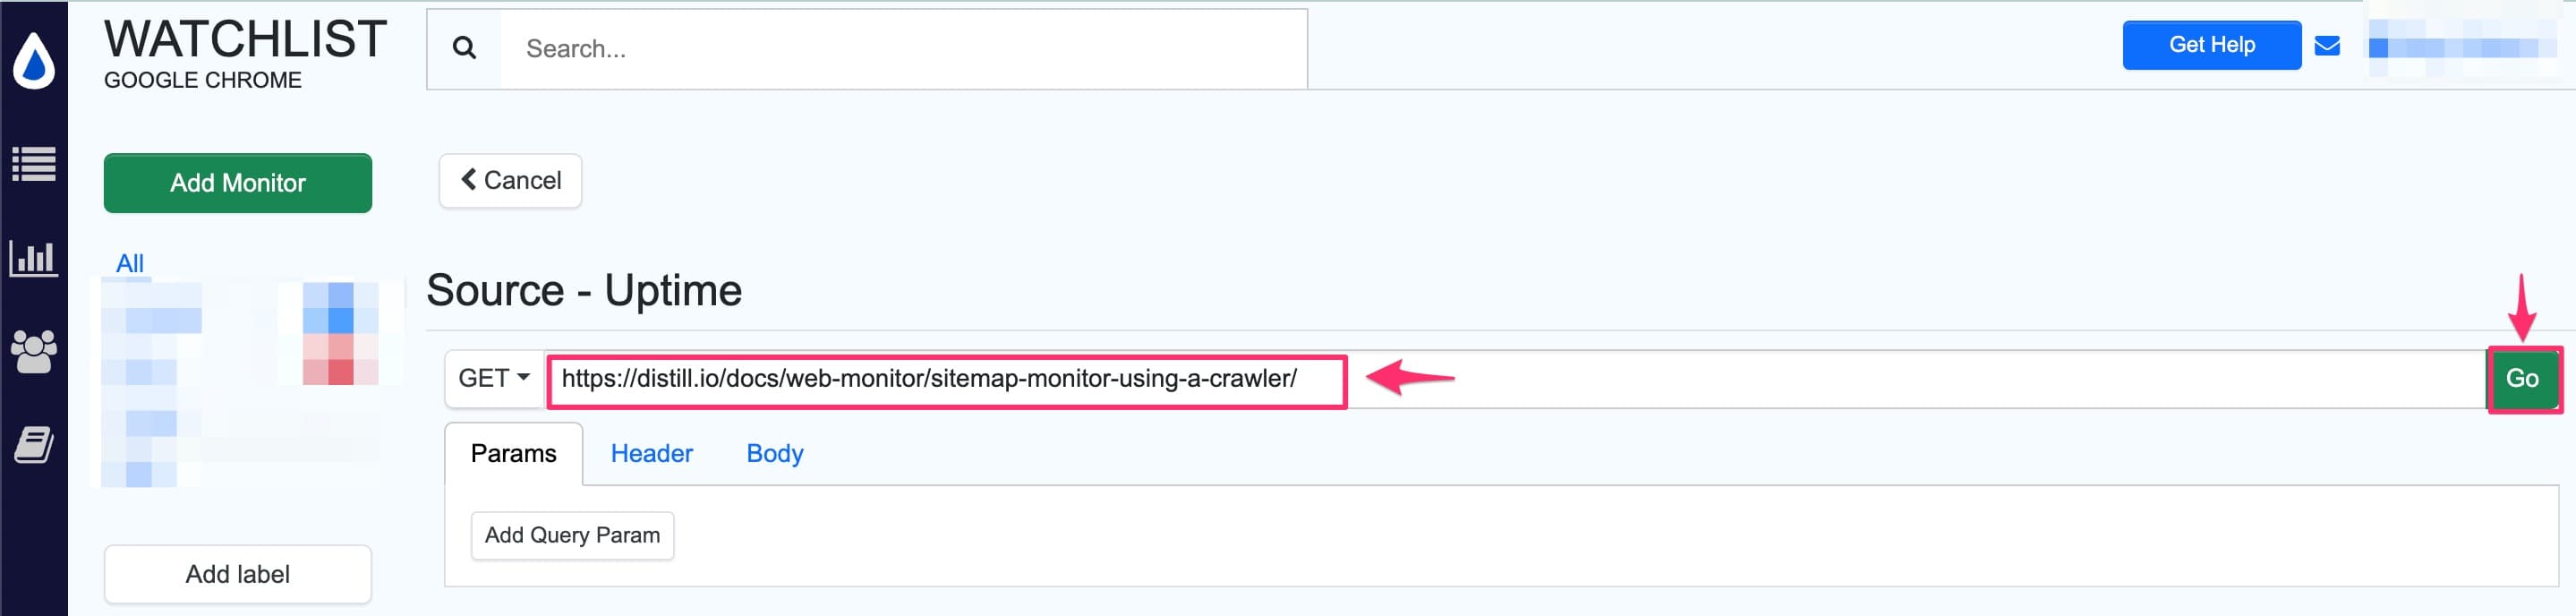
-
Enter the web service URL. Use Add Query Param to add HTTP request parameters, headers, or body content if needed
-
Click GO to send the request
-
Select the properties to monitor and check the preview in the “Distilled” tab
-
Click Save to open the Options page
-
Configure check interval, alert actions, and conditions
-
Click Save to add the uptime monitor to your watchlist
Monitor a page that doesn’t exist yet
You can monitor pages that aren’t yet available. When the page becomes accessible, you’ll receive an alert.
- Create an uptime monitor for the URL
- Select the status property
- When the page goes live, the status code will change from
404(Not Found) to200(OK)